Tuesday, December 29, 2009

The Neuroscience of Science

This article is important.
According to Dunbar, even after scientists had generated their “error” multiple times — it was a consistent inconsistency — they might fail to follow it up. “Given the amount of unexpected data in science, it’s just not feasible to pursue everything,” Dunbar says. “People have to pick and choose what’s interesting and what’s not, but they often choose badly.” And so the result was tossed aside, filed in a quickly forgotten notebook. The scientists had discovered a new fact, but they called it a failure.

Among other keepers in this article: have Jewish thinkers been so successful be so cuccessful because they have been on the outside?

Saturday, December 19, 2009

Reviewing the Bidding on Climate Change

After a few weeks to look over the current state of the science, let's take a look at what's clear and what's confusing:

Science and Politics
  1. Politics and passion are a big part of the story. It's hard to find anybody who will talk about the science of global warming without taking sides or going on the attack. Ask an honest question and you're labeled a "denier" by people who really ought to know better!
  2. There seems to be clear evidence of pressuring editors and manipulating the peer review process.
  3. A recurring complaint is that climatology research depends very heavily on statistics, but the authors of papers lack real expertise in that field.
The Greenhouse Effect
  1. What I thought I knew for sure has been shaken. I believed that everybody agreed that CO2 contributes to some degree of global warming--but that people disagreed on how MUCH it contributed. Now I realize that my basic assumptions about the "greenhouse effect" mechanism were flawed, at best. I can't explain exactly why more CO2 means more heat.
  2. Some people claim that ALL the temperature readings can be explained by a combination of natural solar cycles. Others argue that the solar cycles do a better job of predicting temperatures than the "radiative forcing model" of CO2 and other greenhouse gases.
Surface Temperature Measurements
  1. I also thought I knew that global temperatures had gone up quite significantly in the decades leading up to 2000. Now I'm questioning some of that rise--I'm not confident that the surface measurements haven't been "cherry-picked." I'm not saying there hasn't been some rise--but I'd like to double-check how they selected the data they use to compute it.
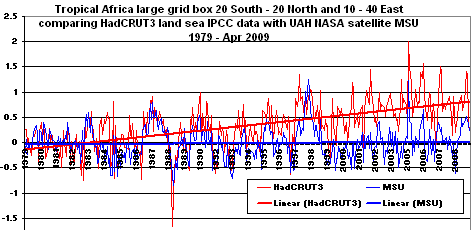
  2. I'm increasingly aware of "divergences" between the land-based surface measurements and other sources of data. Tree rings haven't been matching up to northern hemisphere temperature readings since the 1960s, for some reason. Satellite readings show a divergence from surface measurements--with a larger difference from land-based readings.

Wednesday, December 16, 2009

Thinking About Greenhouse Gases

Why, exactly, does more CO2 in the atmosphere result in more trapped heat?

If CO2 were essentially transparent to infrared waves, I can see why more CO2 would trap more infrared--doubling any transparent gas would double the "dimming" effect of that gas.

But I thought the heat-trapping effect of CO2 came from its absorption spectrum. CO2 is NOT transparent to all wavelengths of infrared radiation. In those wavelengths, CO2 acts like paint, not air. Putting two coats of paint on a window doesn't block twice as much light as one coat of paint.

It's like water--light can't travel very far through water. There's NO visible light a half mile down. Going twice as deep doesn't make it any darker.

So my new question is: which wavelengths of CO2 are only PARTIALLY absorbed by atmospheric CO2?

Saturday, December 12, 2009

Statistics 101

Well, maybe a little more advanced that 101. I could follow the recipe but can't do the math on my own. However, it's nice to see someone who can.

Iowahawk reconstructs proxies.

Monday, December 07, 2009

Looking at NIWA

I have been repeatedly asked to weigh in on back-and-forth claims regarding NIWA, New Zealand's National Insitute of Water and Atmospheric Research. This is flattering--I've always wanted SOMEBODY to ask my opinion on something I know nothing about. But it does mean I now need to do some research. I may as well do it here where I can invite comments from people who may actually know stuff.

WHAT IS NIWA?

First of all, NIWA is into aquaculture--a subject that I'm dreaming about in my spare time. Anything I may have to say that is critical about specific programs and people should NOT be construed to think I oppose NIWA as a whole, any more than critical statements I might make about NASA should suggest that I've ever been anything but a radical NASA fan. But this post is about a current controversy, not decades of fine service to humanity.

NIWA operates the National Climate Database, which I will refer to as CliFlo, which does the following:
The climate database holds data from about 6500 climate stations which have been operating for various periods since the earliest observations were made in the year 1850. The database continues to receive data from over 600 stations that are currently operating.

CliFlo returns raw data and statistical summaries. Raw data include ten minute, hourly and daily frequencies. Statistical data include about eighty different types of monthly and annual statistics and six types of thirty−year normals.
Clearly, this is the kind of raw data that makes a big difference in determining whether our global temperature measurements are valid. I can understand why people would want to make sure that thermometers are properly placed. The questions are (a) who decides what constitutes "proper placement" and (b) how much access do skeptics have to the raw data?

Before I say ANYTHING one way or the other on this issue--I'd prefer a world in which all raw data is always available. That would allow "deniers" to manipulate the data if they want to, but it would make it easy for mainstream scientists to present their arguments rebutting such claims. It makes for a messy and noisy process, but it's consistent with our deep commitments to the scientific method.

The CliFLo data has an end user license agreement which I have read and agree with. Looks pretty straightforward. The user control panel allows for curl requests, which I've used in various PHP routines. I'll have to think about whether I really want to sign up, log in, and start playing with datasets... but it's probably a good way to come up to speed on all this.

WHY IS NIWA UNDER FIRE?

It seems that the controversy is the result of NIWA's attempt to "stitch together" surface measurements over time. The ideal results would come from a thermometer that stays in the same location under unchanged circumstances forever, but humans keep spreading out and changing things. That means that building a long-term database of surface measurements is going to require some judgment calls.

If you're confident of your climatology, you can make those adjustments pretty confidently. That enables you to create much longer-term databases, which give you more reason to trust your climatology. Which is great--as long as you're right.

One of the problems I'm most concerned about is the "Urban Heat Island" (UHI) problem, which IPCC has dismissed as a problem on the basis of a paper by Wang, who was subsequently investigated for fraud and cleared in a very questionable, private, non-standard academic proceeding. If UHI is a real problem, our surface temperature measurements could be way off. If NIWA relies on Wang's research to ignore much of the effect of urban heat, there's bound to be a clash over their probe placements.

How does NIWA address this placement question? According to this press release:
NIWA’s analysis of measured temperatures uses internationally accepted techniques, including making adjustments for changes such as movement of measurement sites. For example, in Wellington, early temperature measurements were made near sea level, but in 1928 the measurement site was moved from Thorndon (3 metres above sea level) to Kelburn (125 m above sea level). The Kelburn site is on average 0.8°C cooler than Thorndon, because of the extra height above sea level.
My guess is that these "internationally accepted techniques" for probe placement are exactly where the controversy lies. NIWA feels completely justified in doing what everybody else agrees is proper. NIWA's critics are skeptical about the underlying science of AGW, and are really challenging the "internationally accepted techniques" themselves.

WHAT DIFFERENCE DOES THIS MAKE?

NIWA has raw data (presumably available on the CliFlo site) that apparently yields this chart:


NIWA's "processed" data produces a different picture from the same data:


Obviously, skeptics are going to need more than a "trust me on this" when the raw data shows a flat line and the "processed" data shows global warming.

HOW DO WE RESPOND TO THIS?

I don't think I can persuade true AGW believers that the internationally accepted adjustment standards are flawed, and I'm not even going to try to persuade "deniers" to trust NIWA. How about if we look around for some other evidence to resolve this impasse?

One historical measurement that gets around the UHI problem is to use proxy measurements that let us look at pristine areas over long time periods. Sediment cores, stalagmites, and tree-rings allow us to compare apples to apples over long periods. Tree rings are NOT more accurate than direct surface measurements, but they aren't subject to the problems that concern me.

I'm looking for New Zealand paleoclimatology papers. It's going to be hard to find what I need from the free stuff online. I'm not able to get the full papers, just the abstracts--and a lot of what really matters is in the paper, not the abstract. Here's what I've found so far:

Just when I thought the CRU folks might actually stuff the genie back in the bottle, we get this spectacularly stupid claim:

Jean-Pascal van Ypersele, the vice-chairman of the Intergovernmental Panel on Climate Change (IPCC), said he believed the theft of the emails was not the work of amateur climate sceptics.

“It’s very common for hackers in Russia to be paid for their services,” he told The Times.

“If you look at that mass of emails a lot of work was done, not only to download the data but it’s a carefully made selection of emails and documents that’s not random at all.

“This is 13 years of data and it’s not a job of amateurs.”

No--it wasn't the job of amateurs. There's every reason to believe the files and emails were assembled by trained professionals--on staff at the CRU, in response to a legitimate freedom of information act request.

The STUPID part of this claim is that it's so sensational that everybody who has been trying to ignore it now has to find a whole new reason to stifle the story. We're down to two irresistable memes--it's either "Deep Throat" or "Boris and Natasha." And when you make rash accusations about nuclear-armed oil-producing states who have a serious dog in the Copenhagen fight, you're making a serious PR error.

Digging into "Freedom of Information"

I'm trying to figure out from internal clues whether the FOIA.zip file at the heart of "Climategate" was hacked or leaked. A close analysis of the directory structure and vestigial email headers supports the theory that the .zip file was assembled in response to a freedom of information act request.

Here's the letter rejecting Steve McIntyre's FOI request:
ENVIRONMENTAL INFORMATION REGULATIONS 2004 – INFORMATION REQUEST (Our ref: FOI_09-44; EIR_09-03)

Pursuant to Mr. Palmer’s letter of 21 September 2009 to you regarding the handling of your appeal of 24 July to our response of the same date in regards your FOI request of 26 June 2009, I have undertaken a review of the contents of our file and have spoken with Mr. Palmer and other relevant staff involved in this matter.
According to McIntyre's blog post on this topic, the files in the FOIA.zip file go up to the day before the FOI request was refused. This comprehensive network analysis of the emails and other documents supports the hypothesis that the files were gathered pursuant to a FOI request.

Tracking back through the Internet, I find plenty of correspondence about Steve McIntyre's FOI requests. Here's one from July 24, 2009, documenting his request and CRU's rejection. The internal naming conventions revealed in this correspondence with CRU is "FOI_09-44," which certainly fits with somebody at CRU assembling a file named "FOI-something."

An Internet search for all documents containing "FOI_99" turns up lots of correspondence with CRU, and includes direct references to the relevant law--the British "Freedom of Information Act." That suggests that the original directory structure might easily have been FOIA, meaning there is no internal evidence to suggest the FOIA.zip file came from anywhere but CRU's own official files.

The timing of the dates of emails in the directory helps track down where the file came from. Files were being added to the directory up until 2:17 pm on Thursday, Nov. 12, 2009, the day before the rejection decision was made on Friday, Nov. 13, 2009. The FOIA.zip file first appeared on the Internet on Nov. 17, 2009. Given the size and nature of the FOIA.zip file, it seems likely that CRU staff were compiling the directory in response to one or more requests for information.

Somewhere during the five days between Nov. 12 and Nov. 17, somebody grabbed the file. If the contents of the directory seemed directly relevant to Steve McIntyre's FOI_99-44 request, it would seem like the file could have been grabbed at any time during those five or six days. If, on the other hand, the directory covers a lot more than just the files that would be assembled in response to FOI_99-44, then is makes more sense to assume the file was copied off on Nov. 12 or Nov. 13 by someone who was involved in either compiling the directory or in rejecting the request.

BUT--just to make things MUCH more interesting, the BBC got a copy of SOMETHING a full six weeks before the FOIA.zip file went rogue on November 17. That makes it very hard for me to think we're dealing with a hacker rather than a leaker.

Measuring the Measurements

This graph is one of the reasons I'm getting more skeptical about the Global Warming claims. Look at the lines in the graph. The bottom lines clearly show what used to be known as the "Medieval Warm Period" and the "Little Ice Age." The top lines show what people call the "Hockey Stick." In the run-up to the present, all the lines converge on a sharp up-slope.


If all the data is equally good, it makes sense to average things out and get a mild roller-coaster effect. If some of the data is unreliable, it makes sense to throw it out. I'm troubled by the possibility that researchers are motivated to find new lines of evidence that "eliminate" the Medieval Warm Period, but are not equally motivated to find evidence that confirms it. I'm suspicious that journals and grant agencies may call evidence of the MWP "old news," unworthy of grants or print, while evidence against it is "hot" and deserves fast-track treatment.

Friday, December 04, 2009

Urban Heat Islands

The more I look into the questionable foundations of climatology, the more nervous I get. One BIG assumption in the data for the last 60 years or so has been that "urban heat islands" are not artificially raising the measured temperatures. The urban heat island problem is pretty easy to understand: if you take the temperature of downtown Boston, you'll get a warming reading than if you take the same reading at Walden Pond (same latitude but a lot less people).

When you aggregate temperature readings from thousands of stations scattered all over the globe, you want to make sure that you are measuring the heat of the planet, not just the increased heat from islands of furnaces and air conditioners (both of which make things hotter, due to the miracle of the Second Law of Thermodynamics).

This article goes into a long email correspondence with one scientist inside the Climate Research Unit (CRU) who was clearly uncomfortable with the evidence other scientists relied on to discount the Urban Heat Island problem. You have to read all the way to the bottom to see his point, but its a good one.

Subverting Science

When a big televangelist gets caught with a hooker, priests and pastors are dismayed and immediately repudiate that sin. What happens when a scientist sins against the scientific method and peer review process?

Here's a specific claim by someone who is carefully following one thread of Climategate:
the Wahl and Ammann paper as finally published online on 31 August 2007...was in fact published in 2007, is nothing like the draft seen by the Expert Reviewers, and accordingly should not be referred to in the IPCC 2007 report released in May 2007? Instead the IPCC should have reflected the published peer-reviewed literature and concluded that the 2001 IPCC hockey stick was statistically invalid.

David Holland, the author of this quote filed a freedom of information request,asking (as far as I can tell) for information relating to the publication of this paper. Two days later, UEA Director Prof Phil Jones asked Professor Michael Mann (lead author of the "hockey stick") to tell his ex student Ammann to delete these emails. According to Holland, this is what leaked email 1212063122 is about.


There's something VERY suspicious about asking anyone to ask anyone else to delete emails that have been requested under a Freedom of Information Act request. Watergate was just a "third rate burglary" that toppled a president. Climategate could turn out to be even bigger.

Is Global Warming Man-made or Mann-made?


In my opinion, the "hockey stick chart" is the dominant icon of the Anthropogenic Global Warming (AGW) debate. It was produced by Michael Mann of Penn State in 2001 and relied on by a number of prominent scientists and government agencies, but was challenged and eventually abandoned.


What intrigues me about the hockey stick chart is its reliance on temperatures since 1960 and on other measurements (such as ice cores and tree rings) prior to that. The correlation between tree ring data and measured temperatures is fundamental to this model, which makes the following graph of tree rings and temperatures somewhat sensational:


Insofar as the "hockey stick" represents what people are debating when they talk about "Global Warming," I'd say it's definitely "Mann-made."

Wednesday, December 02, 2009

Hide the Decline

I've been hearing this phrase a lot (it now comes with its own music video), but a picture is worth a thousand words:


This particular picture comes from a discussion of the whole "decline" issue at ClimateAudit.com. The black line is the measured width of tree rings. The red line is the reported global temperature. The "decline" begins around 1960. As you can see, it shows a big difference between what the tree rings say and the weather experts report.


I can't explain WHY there is such a difference... but it sure reduces my confidence in ancient temperature reconstructions. If we can't match global temperatures to tree rings in the last fifty years (when we were actually able to check the correlations), why should we believe anything anybody says about temperatures hundreds of years ago?

Tuesday, December 01, 2009

Climategate's Commenters

Scanning the mainstream media articles on the East Anglia emails, I've been surprised at the makeup of the comments. They are OVERWHELMINGLY skeptical (of anthropogenic global warming), no matter how left-leaning the publication may be. Why should this be so?

My guess is that those who believe in man-made global warming have precious little to say about the Climate Research Unit (CRU) files, so they aren't even trying to defend them. The skeptics have been scorned and shunned for a LONG time, so they've got a LOT to say. The comments section of major papers has no way to "balance" a situation like this, so you wind up with a journalist reporting on a story, followed by a ton of people piling on.

It adds up to an interesting corrective to the way media works. It looks like a dissenting minority no longer needs to think in terms of "taking back" the media to get their voice heard, even when the sociological structures are overwhelmingly in favor of one position.